
About PonTan Charts
summary
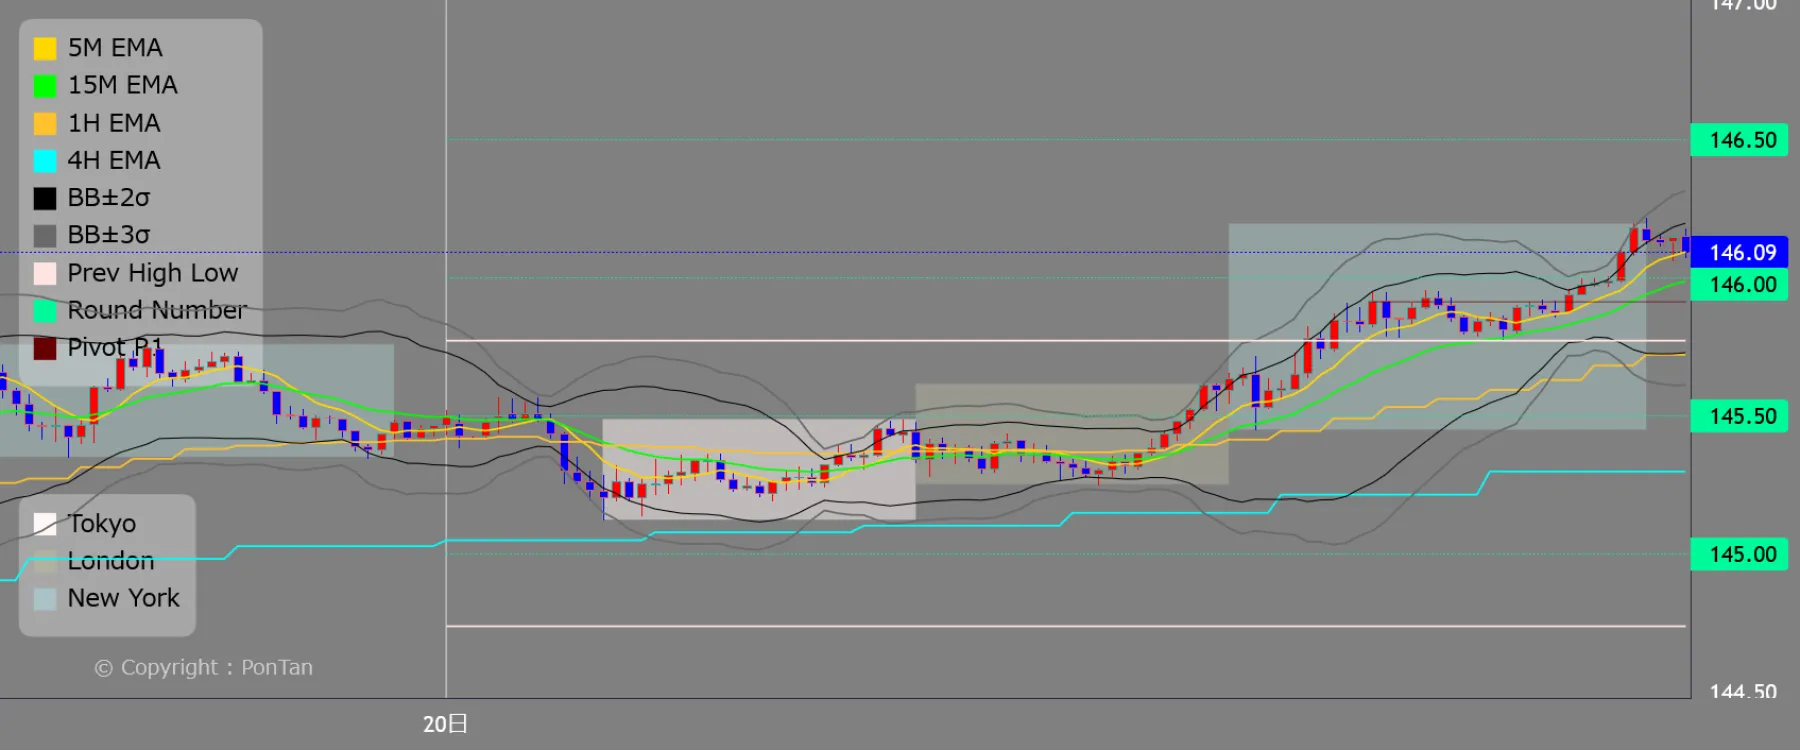
The PonTan chart shows price movements over a 5-day period, including the day recorded in the logbook. Only the 15-minute chart is displayed. The mouse wheel can be used to zoom in and out, and left and right scrolling allows you to go back and check past price movements. The vertical line indicates the date line, which is always displayed, but the date at the bottom may be omitted depending on the zoom factor. Charts for the day of the logbook are automatically updated every 15 minutes. When the date changes, only the chart corresponding to that day's logbook is subject to subsequent updates; charts for other dates are fixed. This is intended to "keep a history of the charts you were looking at in real time that day.
The following four currency pairs can be displayed.
- USDJPYUSD/JPY
- EURUSDEuro/U.S. Dollar
- GBPUSDGBP/USD
- AUDUSDAUD/USD
PonTan trades essentially only in the straight dollar.
This is due to the fact that technical analysis is more effective than with cross currencies, making it easier to make clear trade decisions.
List of indicators displayed

5M EMA: Auxiliary lines to capture ultra-short-term flow
15M EMA: Visualize short-term wave direction
1H EMA: Medium-Term Trend Indicators
4H EMA: Supplementing the big picture market trend
BB±2σ: General volatility range
BB±3σ: Overheat/Undersignal Range
Prev High Low: High/Low of previous day
Round Number: Price of a good price (psychological milestone)
Pivot Point (PP): The center of gravity of the day's price calculated from the previous day's high, low and close
Pivot R1: First resistance line
Pivot R2: Second resistance line
Pivot R3: Third resistance line
Pivot R4: Fourth resistance line
Pivot R5: Fifth resistance line
Pivot S1: First support line
Pivot S2: Second support line
Pivot S3: Third support line
Pivot S4: 4th support line
Pivot S5: 5th support line
Pivot lines (S1-S5 / R1-R5) and Round Number are displayed on the chart only when the price is reached.
Display by Market
The chart background shows a band for each session.
Tokyo time
London time
New York Time
Indicator detail settings
15M EMA: 15-minute exponential smooth moving average
1H EMA: Hourly Exponential Smooth Moving Average
4H EMA: 4-hour exponential smooth moving average
BB±2σ: Bollinger Band 2σ
BB±3σ: Bollinger Bands 3σ
FX Diary